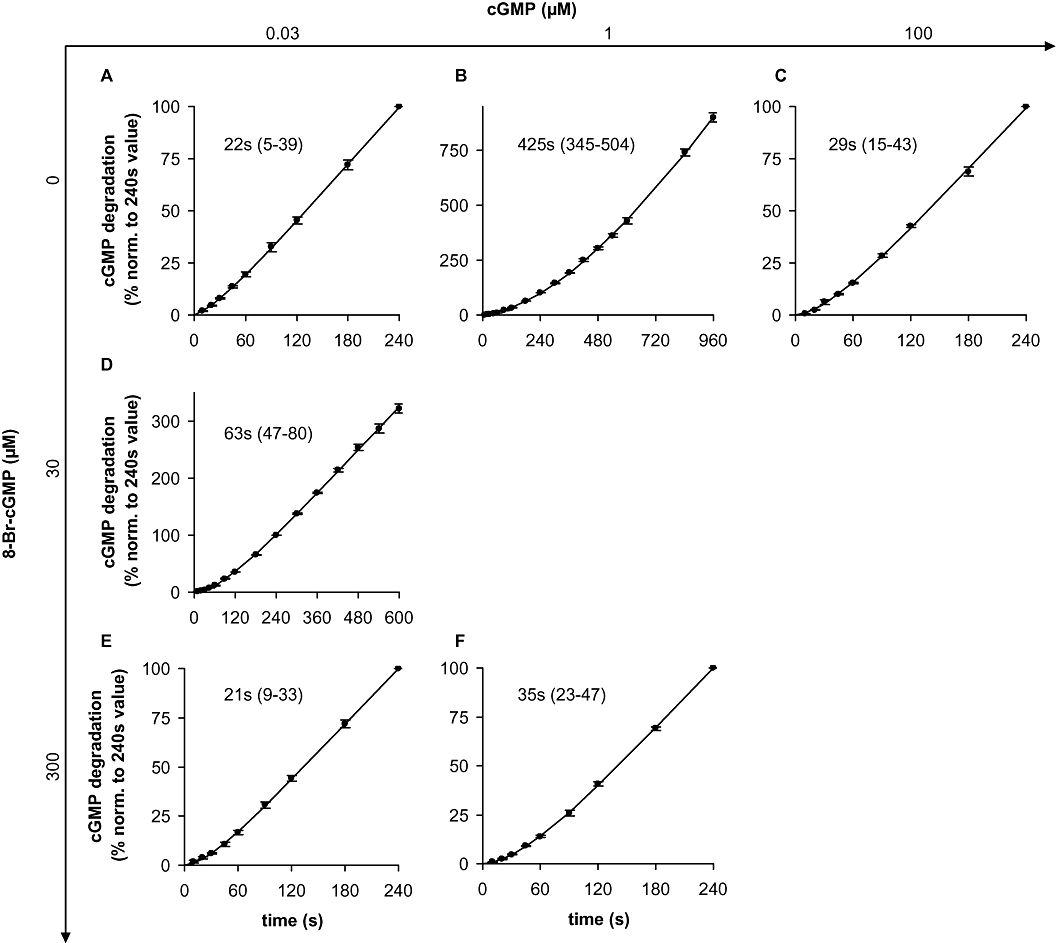
Figure 5.

PDE5 activation kinetics: GMP accumulation and statistical analysis. GMP accumulation was measured at the indicated time points in cytosolic fractions of PDE5 overexpressing HEK cells at 0.03 µM (A, D, E), 1 µM (B, F) or 100 µM (C) cGMP as substrate either in the absence (A, B, C) or in the presence of 30 µM (D) or 300 µM (E, F) 8-Br-cGMP. The reactions were carried out as described in detail in Methods. Data are normalized to the GMP value at 240 s to reduce scatter caused by different PDE5 expression levels. Data shown are mean ± SD of at least three independent experiments performed in duplicate. Values for half-life and 95% confidence intervals (in parentheses) were calculated by non-linear regression as described in Methods.
