
Figure 6.
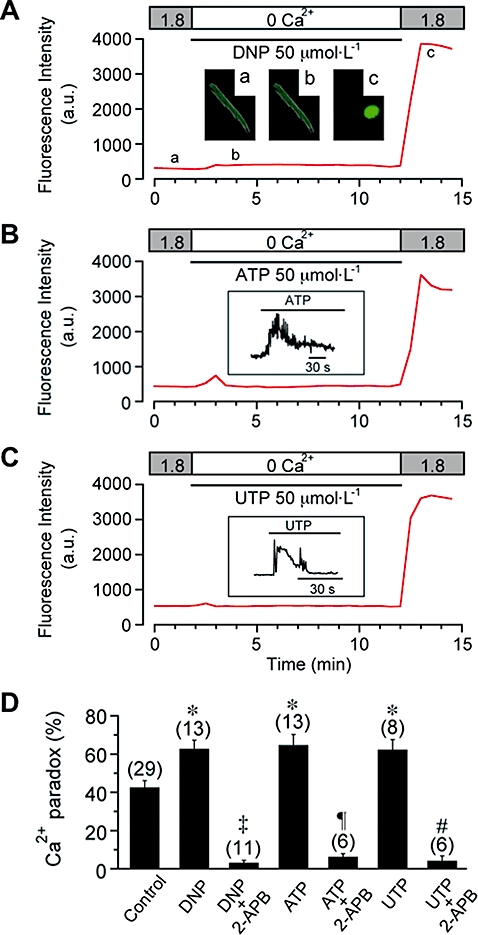
Potentiation of Ca2+ paradox by metabolic inhibition or by the presence of extracellular ATP and UTP. (A) Effect of metabolic inhibition during Ca2+ depletion on the Ca2+ paradox. DNP (50 µmol·L−1) was added (and glucose was removed) during Ca2+ depletion, as indicated. Inset shows fluorescence images at time points (a, b, c) indicated in (A). (B) and (C) Effect of extracellular ATP (50 µmol·L−1, B) and UTP (50 µmol·L−1, C) during Ca2+ depletion on the Ca2+ paradox. Inset shows fluorescence signals (acquired every 0.4 s) displaying Ca2+ transient evoked by ATP (B) and UTP (C) on an expanded time scale. Fluorescence intensity was measured every 30 s in experiments shown in panels (A) (B) and (C). (D) Potentiation of Ca2+ paradox by DNP (62.8 ± 4.5%, n = 13, N = 4), ATP (64.8 ± 5.5%, n = 13, N = 5) and UTP (62.4 ± 5.2%, n = 8, N = 3), and its inhibition by 2-APB (3.2 ± 1.2%, n = 11, N = 2; 6.3 ± 1.6%, n = 6, N = 2; and 4.2 ± 2.5%, n = 6, N = 3 respectively). *P < 0.05 compared with control (42.6 ± 3.5%, n = 29, N = 9); ‡P < 0.01 compared with DNP without 2-APB; ¶P < 0.01 compared with ATP without 2-APB; #P < 0.01 compared with UTP without 2-APB. There was no significant difference between the ATP and UTP groups.