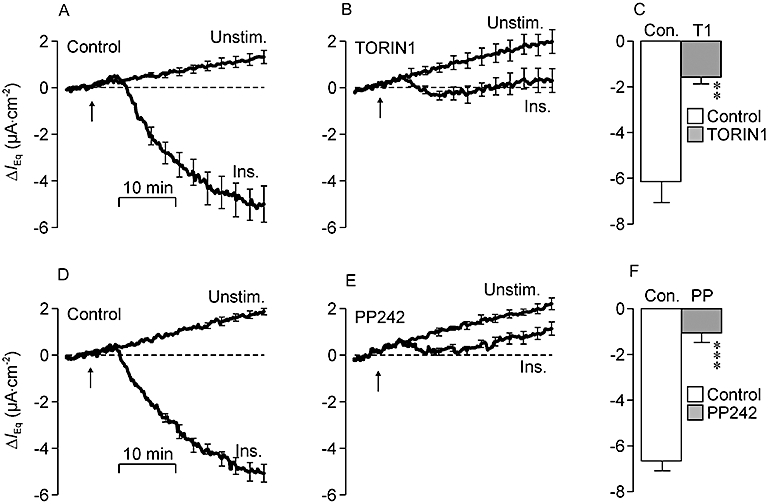
Figure 3.

Effects of TORIN1 and PP242 upon the electrometric response to insulin. In this and in all subsequent such figures the values of equivalent short circuit current (IEq) measured during the initial 5 min of each recording period (i.e. the basal IEq) has been subtracted from all subsequently measured data points so that each presented trace shows the changes (mean ± SEM, n = 5) from this basal value (ΔIEq). (A) Values of IEq derived from unstimulated and insulin-stimulated (Ins.; 20 nM, basolateral, arrows) control cells. In this series of experiments the values of basal IEq quantified in the unstimulated (Unstim.) and insulin-stimulated cells were −14.4 ± 1.9 µA·cm−2 and −17.0 ± 2.0 µA·cm−2 respectively. (B) Data from age-matched cells pretreated (30 min) with 0.1 µM TORIN1 (basal IEq unstimulated cells: −13.6 ± 1.2 µA·cm−2; basal IEq insulin-stimulated cells: −14.6 ± 1.4 µA·cm−2). (C) Responses to insulin in control (Con.) and TORIN1-treated cells were quantified by measuring the change in IEq that developed during exposure to hormone and subtracting the spontaneous change measured in unstimulated cells. (D) Data showing the spontaneous and insulin-induced changes in IEq in control cells (basal IEq unstimulated cells: −17.5 ± 1.0 µA·cm−2; basal IEq insulin-stimulated cells: −20.1 ± 1.6 µA·cm−2). (E) Data from age-matched cells pretreated (30 min) with 1 µM PP242 (basal IEq unstimulated cells: −13.9 ± 1.1 µA·cm−2; basal IEq insulin-stimulated cells: −15.7 ± 1.3 µA·cm−2). (F) Responses to insulin measured in control and PP242-treated cells. **P < 0.01; ***P < 0.005, significant responses to insulin; Student's paired t-test.
