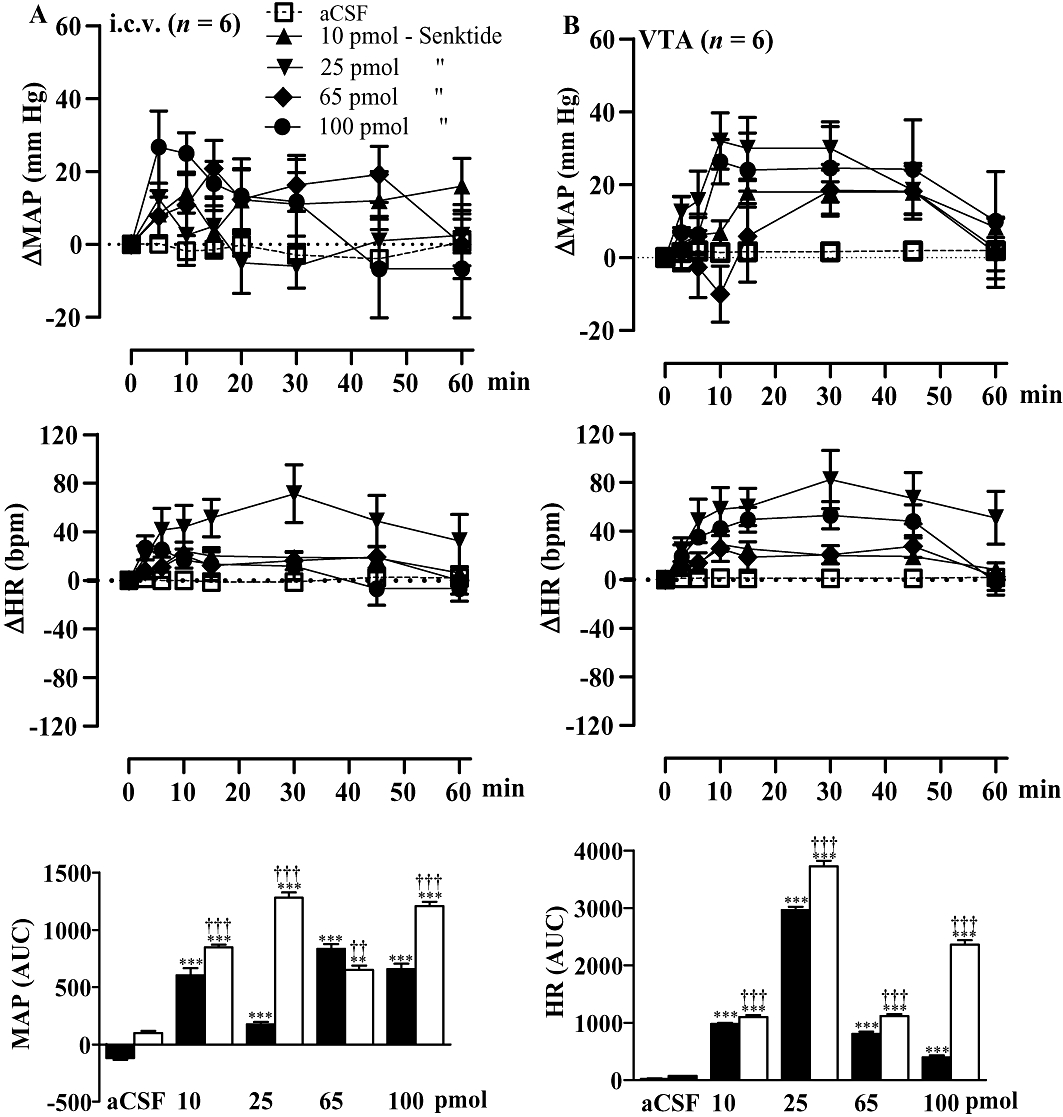
Figure 6.

Time-course effects on changes in mean arterial blood pressure (ΔMAP) and heart rate (ΔHR) following i.c.v. (A) or ventral tegmental area (VTA) (B) injection of four increasing doses (10, 25, 65 and 100 pmol) of senktide in spontaneously hypertensive rats. Areas under the curves (AUC) were measured for a period of 0–1 h (open columns for VTA and solid columns for i.c.v.). Values represent the mean ± SEM of six rats per injection site. Significant difference from aCSF values (*) or i.c.v. (†) is indicated by **††P < 0.01; ***†††P < 0.001.
