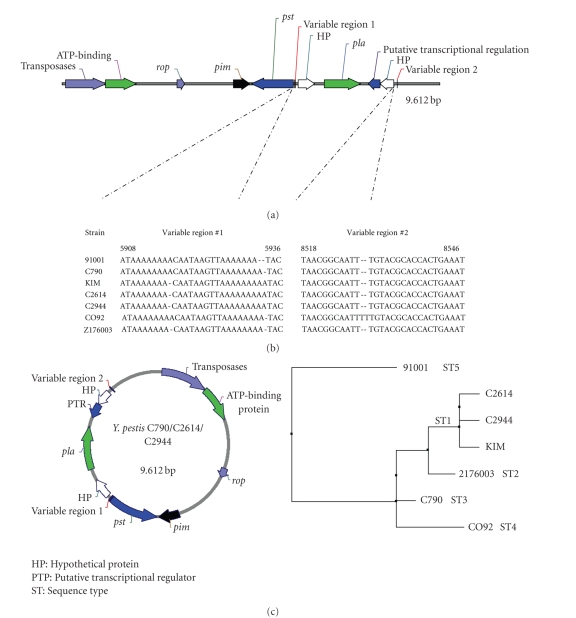
Figure 3.
Structural comparison of the pPCP1 plasmids in the FSU's Y. pestis strains and a previously characterized strain Y. pestis CO92. (a) Schematic linear diagram of the pPCP1 plasmid in strain CO92, which shows the locations of variable regions no. 1 and no. 2 present in the FSU strains' pPCP1 plasmids. (b) Sequence variations in variable regions no. 1 and no. 2 in the pPCP1 plasmids examined during our studies. (c) Schematic composition of three pCP1 plasmids in the FSU's Y. pestis strains, and their genetic relatedness (based on neighbor joining tree analysis) to the three pCP1 plasmids from non-FSU strains.

