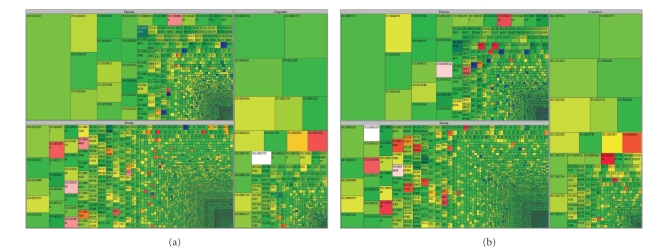
Figure 1.
Ontological coverage of (a) the BOM, and (b) SPAM oligonucleotide microarrays. The classes of proteins represented by oligonucleotides were analyzed by comparing the proportion of bovine Gene Ontology (GO) terms connected to the BOM and SPAM targets. All bovine GO terms were extracted from NCBI and are displayed using Treemaps, divided into the three ontologies (biological process, molecular function, and cellular component). The number of bovine genes per GO term is proportional to block size and the ratio of BOM or SPAM representation for each GO term is indicated by color; black = no probes, from white (50-fold lower) to blue (10-fold lower) indicates under-representation, green indicates equal representation, from yellow (10-fold higher) to red (≥50-fold higher) indicates over-representation. The number of blocks, their size, and their color is a global overview of GO representation.

