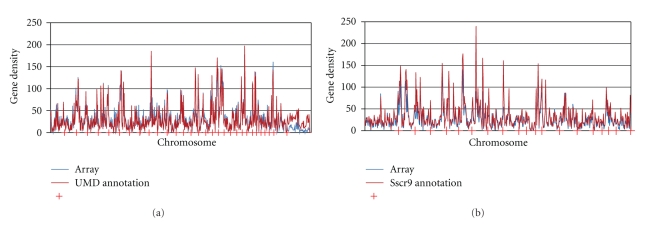
Figure 2.
Genome-wide representation of oligonucleotide target sequences on the BOM and SPAM. The positional distribution of targets (blue) is plotted relative to the (a) bovine (BOM), or (b) porcine (SPAM) chromosomes (red) to demonstrate the genome-wide representation of targets on the microarray.

