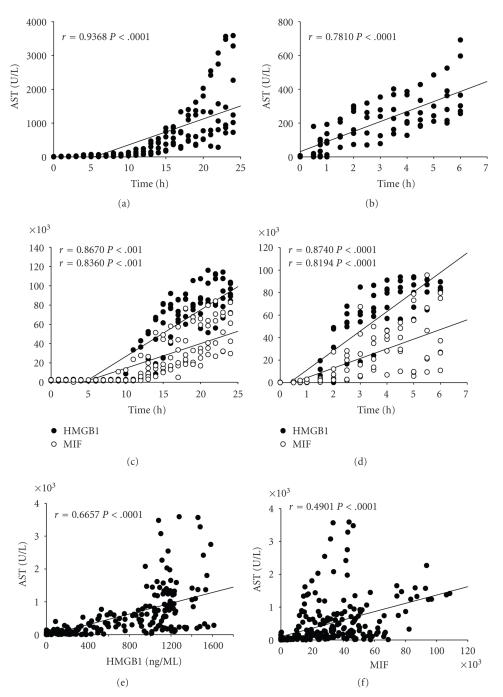
Figure 6.
Correlation of Effluent HMGB1 and MIF with liver enzymes (AST) and ischemic time. Effluent AST positively correlated with cold or warm ischemic time ((a) and (b)), respectively, (P < .0001). For HMGB1, the values represent the density of band using Image J program ((c) and (d)), or the values represent the concentration quantified by recombinant standard (e). For MIF, the values represent the density of band using Image J program. Effluent HMGB1 and MIF levels correlated moderately with ischemic time ((c) and (d); P < .0001) and effluent AST ((e) and (f); P < .0001).

