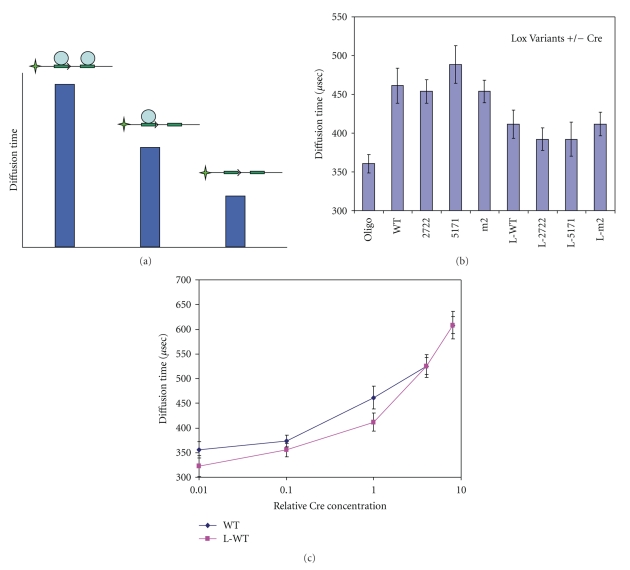
Figure 3.
Measure of Cre affinity for sites by FCS microscopy. (a) Strategy to measure Cre affinity for sites: The diffusion time of labeled oligos as measured by FCS increases depending upon the number of Cre molecules bound. Labeled oligo unbound by Cre would exhibit the highest diffusion rate (shortest diffusion time) (right). Labeled oligo with a single Cre molecule bound would have a decreased diffusion rate (increased diffusion time) (middle). Labeled oligo with both inverted repeat sites occupied by Cre would have the lowest diffusion rate (longest diffusion time) (left). (b) Diffusion times of Alexa 488-labeled PCR products containing Lox sites were measured by FCS. The times for Lox fragment alone and Lox fragments in the presence of Cre (2.5 U/50 ul) were displayed in micro seconds (μs) with error bars showing the standard error of the mean. (c) Diffusion times of Alexa 488-labeled PCR products containing a LoxP or a L-LoxP site were measured by FCS for 10-fold dilutions of Cre. Times were displayed in micro seconds (μs) with error bars showing the standard error of the mean. LoxP shown in blue and L-LoxP shown in purple.

