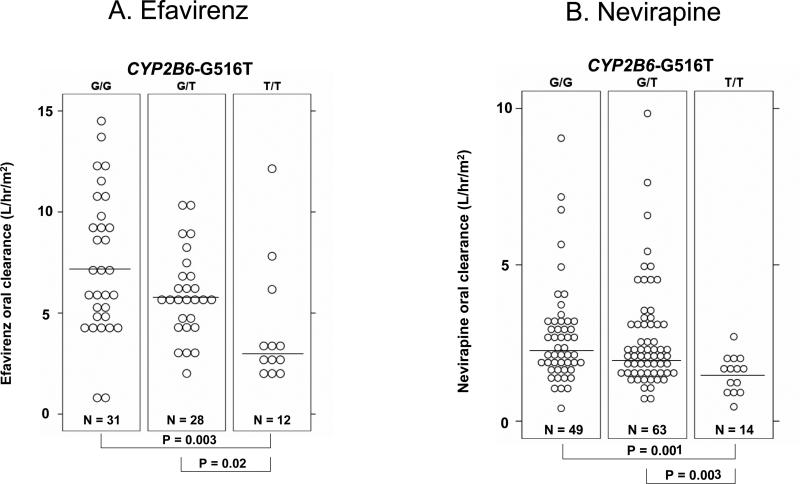
Figure 3. Oral clearance rate (L/h/m2) for efavirenz (A) and nevirapine (B) in children with the CYP2B6-G516T genotypes.
Each circle represents efavirenz (A) or nevirapine (B) oral clearance (L/h/m2) in each subject with the CYP2B6-516-G/G genotype (left), -G/T genotype (middle), and -T/T genotype (right). The lines in the middle represent the median of oral clearance rate for efavirenz (A) or nevirapine (B).

