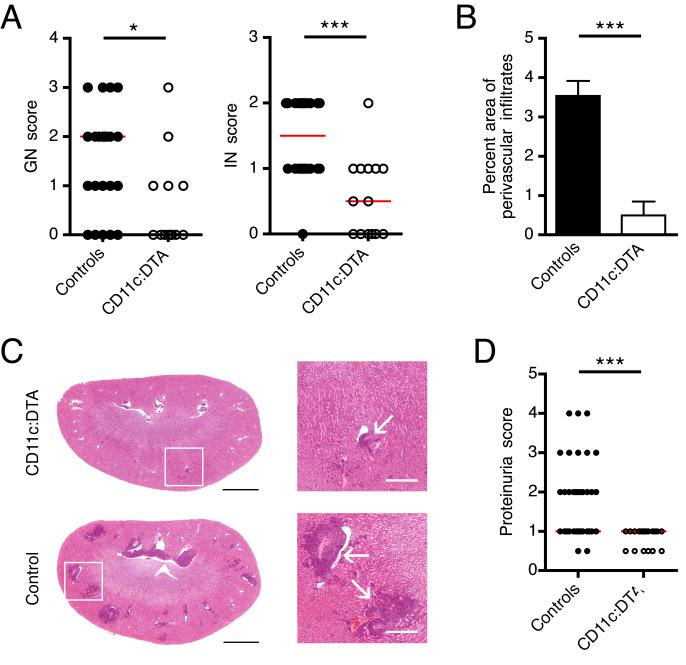
Figure 1. Ameliorated lupus nephritis in DC-deficient mice.
(A) Glomerular and interstitial (peritubular and perivascular) renal disease were scored from 0 to 4 for control and CD11c:DTA mice. Each dot represents an individual mouse. Horizontal lines represent the median.
(B) The area of perivascular infiltrates expressed as a percentage of the total kidney section area is plotted for control (n = 24) and CD11c:DTA (n = 14) mice. Data are represented as mean ± SEM.
(C) Representative H&E stained kidneys sections (left, scale bar = 2 mm) and magnified details of white bordered area of both kidney sections (right, scale bar = 500 μm). Arrows indicate perivascular infiltrates.
(D) Proteinuria for control and CD11c:DTA mice. Each dot represents an individual mouse. Horizontal lines represent the median.
Statistics were calculated by two-tailed Mann-Whitney U test. *p < 0.05; ***p < 0.001.

