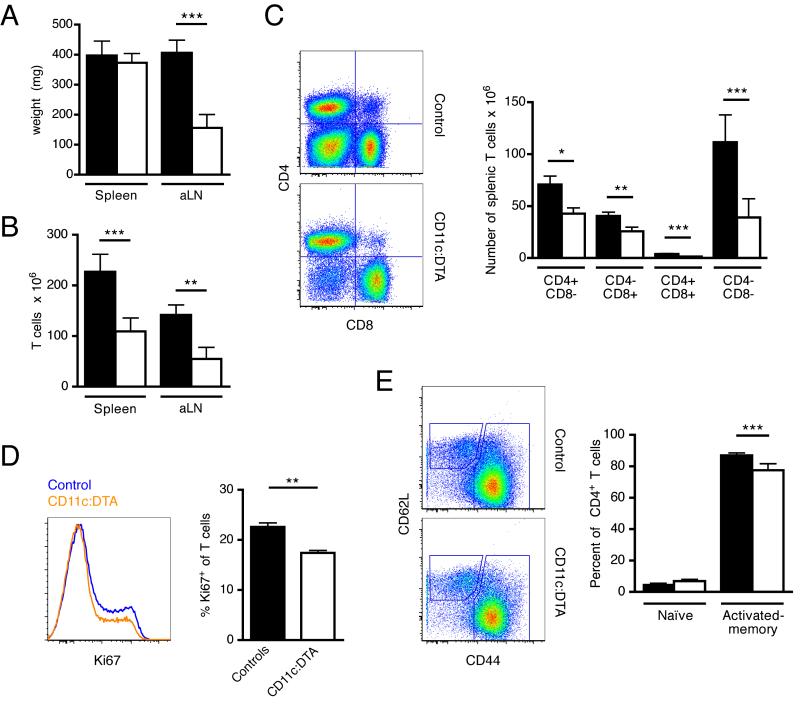
Figure 6. DCs are critical for T cell expansion but not activation.
(A) Weight of spleens and the two largest axillary lymph nodes of control (black bars) and CD11c:DTA (white bars) mice.
(B—C) Cell numbers per spleen of control (black bars) and CD11c:DTA (white bars) mice for total T cells (B) or the T cell subsets CD4+, CD8+, CD4+CD8+ and double negative (C). Panels on the left show sample flow cytometric data.
(D) T cell proliferation determined by Ki67 staining. The histogram on the left shows representative examples of Ki67 staining of gated EMA−TCRβ+ cells.
(E) CD44 and CD62L staining of CD4+ T cells of 16 wk old control (black bars) and CD11c:DTA (white bars) mice to identify naïve (CD44loCD62Lhi) and activated-memory (CD44hi) subpopulations. Representative flow cytometric data on gated CD4+ T cells is shown on the left.
Data in bar graphs are represented as mean ± SEM. (A—C) n = 24 for control mice and n = 14 for CD11c:DTA mice. (D—F) n = 12 for control mice and n = 9 for CD11c:DTA mice. Statistics were calculated by two-tailed Mann-Whitney U test. *p < 0.05, **p < 0.01, ***p < 0.001.

