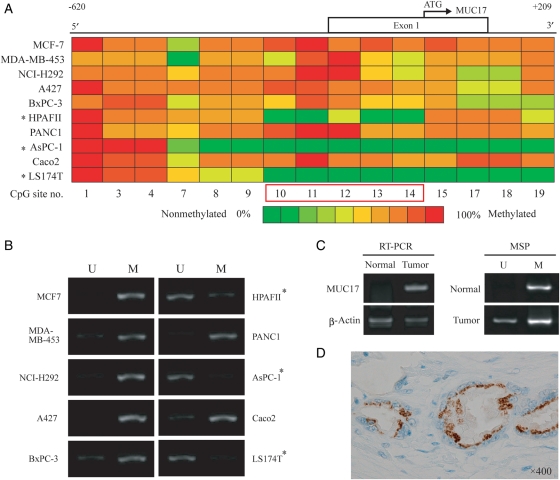
Fig. 2.
Methylation pattern of MUC17 promoter and MSP analysis in cell lines and biological samples. (A) Quantitative methylation analysis of CpG sites located in the MUC17 promoter using a MassARRAY compact system. Different colors display relative methylation changes in 10% increments (green = 0%, red = 100% methylated). CpG sites that correlated well with MUC17 expression are boxed in red. *MUC17-positive cell lines. (B) MSP analysis of 10 cancer cell lines. The PCR products labeled M (methylated) were generated by methylation-specific primers and those labeled U (unmethylated) were generated by primers specific for unmethylated DNA. (C) Correlation between the mRNA expression level and methylation status in the 5′-flanking region in the normal pancreas (N) and tumoral pancreatic tissues (T) from patients with PDAC. Semi-quantitative RT–PCR and MSP analysis were carried out, respectively. (D) Immunohistochemical staining for MUC17 in a patient with PDAC. The carcinoma cells show granular staining in the supranuclear areas (×400, original magnification).

