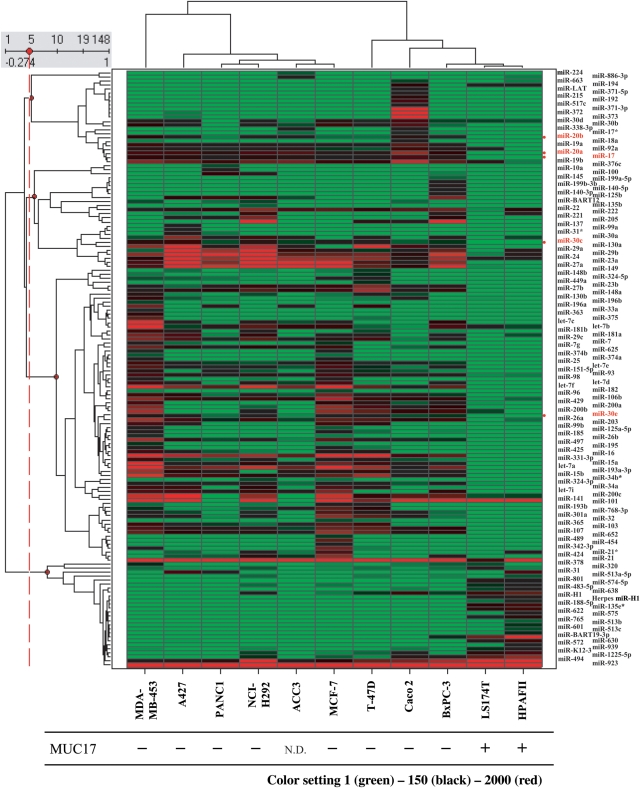
Fig. 4.
miRNA expression profiles of 11 human cancer cell lines. The heat map shows the 148 miRNAs for which the maximum or minimum signal differed by more than twice among the 11 cancer cells. The cluster shows correlated groups of miRNAs and cell lines. The five miRNAs with the potential for MUC17 regulation are highlighted in red. The MUC17 protein expression pattern is shown below. Reprinted, with permission and modification, from Yamada et al. (2010).

