Figure 3.

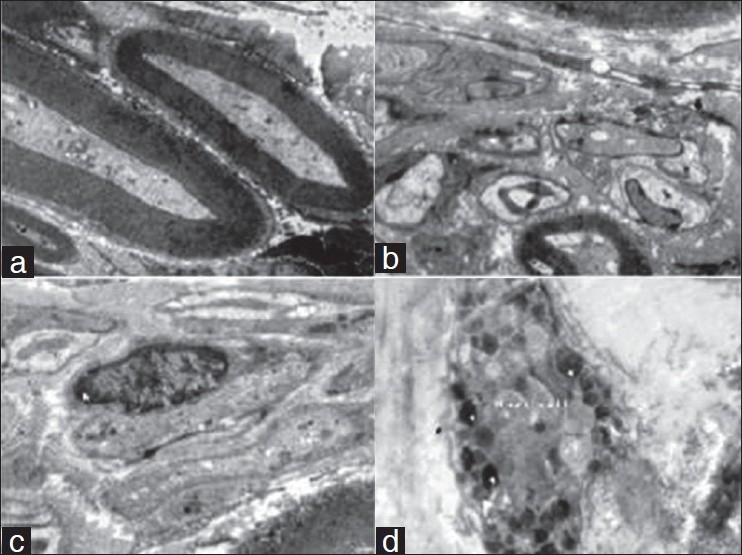
Electron microphotograph of the deep fascia showing (a) myelinated nerve axon (×4000). (b) Nonmyelinated nerve axon (×4000). (c) Schwann cell with nucleus (n) (×4000). (d) Mast cells with granules (g) and villous projection (f) (×4000).

Electron microphotograph of the deep fascia showing (a) myelinated nerve axon (×4000). (b) Nonmyelinated nerve axon (×4000). (c) Schwann cell with nucleus (n) (×4000). (d) Mast cells with granules (g) and villous projection (f) (×4000).