
Figure 4.
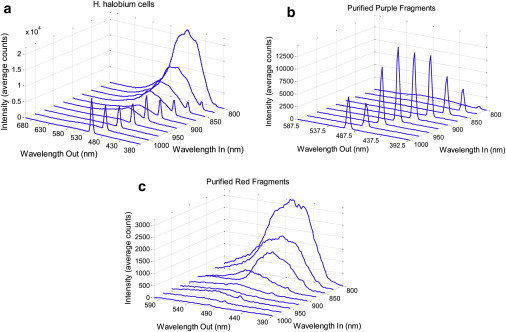
Emission spectra as functions of the excitation wavelength, tuned from 1025 nm to 800 nm for (a) H. halobium prepared with high bR expression levels, (b) isolated purple membrane fragments, and (c) isolated red fragments. The sharp spikes correspond to SHG, while the broad emission arises from autofluorescence. The intensity scale on panel c is approximately fivefold lower than panels a and b.