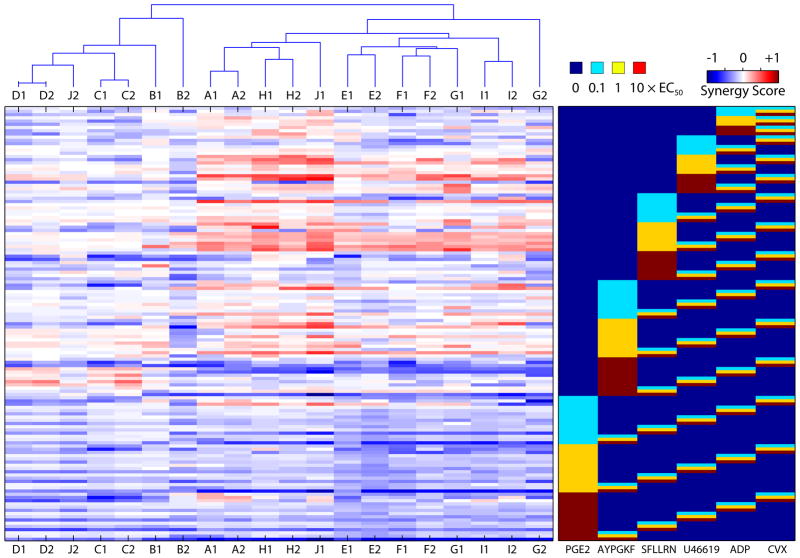
Figure 4. Donor-specific synergy maps.
Ten healthy donors were phenotyped for platelet calcium response to all pairwise agonist combinations. Repeat experiments were conducted within 2 weeks. Donors (Ages: 22–30 years) spanned several ethnic groups (3 Western Europeans, 2 Asians, 2 Indians, 1 Caribbean, 1 African American and 1 African). The magnitudes of synergy in each of the 20 donor specific synergy maps were arranged as columns of the synergy matrix. These vectors were clustered according to similarity using a distance-based clustering algorithm.

