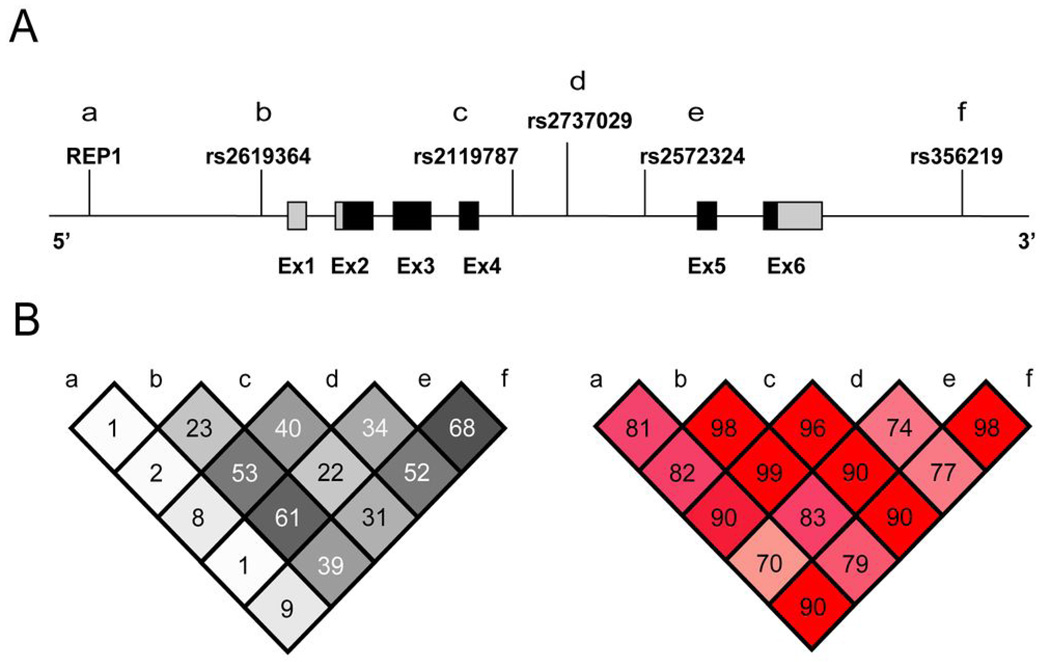
Figure 1.
Schematic of the SNCA gene and patterns of LD. (A) The positions of REP1 and the five SNPs significantly associated with PD in Tier 1 are shown. Coding and non-coding sequence is indicated by black and light gray shading, respectively. (B) Pairwise LD between REP1 and these five SNPs as measured by r2 (left) and D’ (right) in the combined control sample. REP1 alleles 259 and 261 were grouped together.

