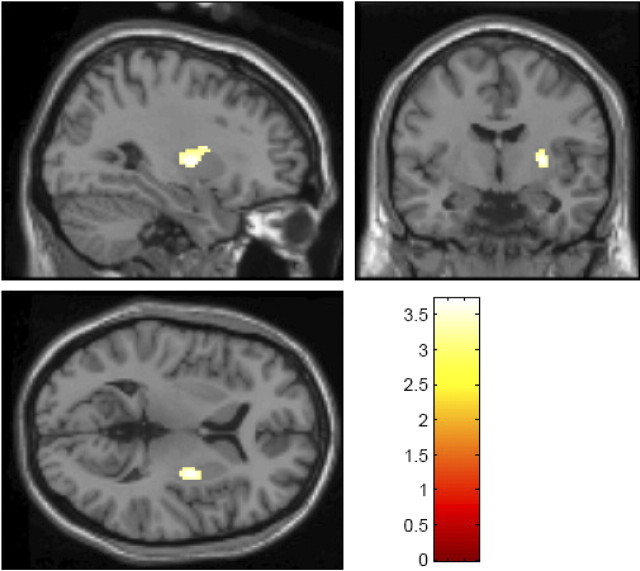
Figure 1.
Statistical maps depicting results of voxelwise analysis of striatal 18F-DOPA uptake (fall–winter group > spring–summer group), with a threshold of p < 0.05, false discovery rate corrected for multiple comparisons, overlaid on a standard single-subject T1-weighted anatomical magnetic resonance image provided in the SPM software package. Color legend refers to t values. Images are displayed using radiological conventions (cluster shown is on the left side).

