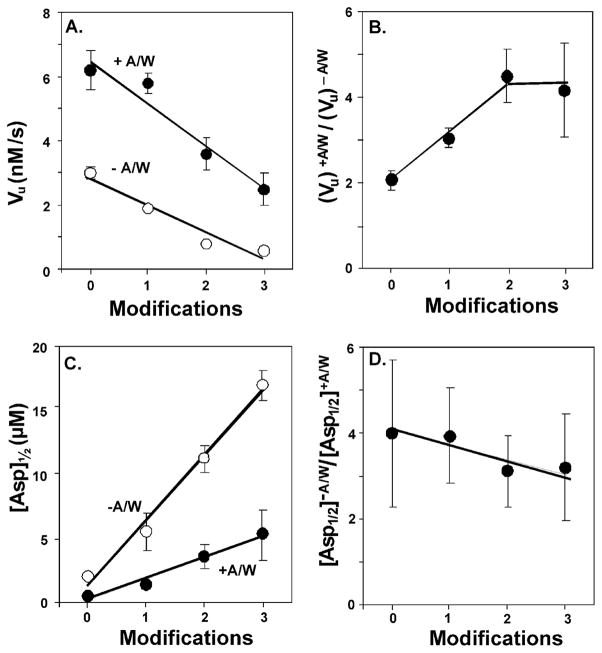
Fig. 3. Effects of adaptational modification on parameters derived from dose-response curves.
A. Means (circles) and standard deviations (error bars) for vu, initial velocity of methylation, derived from the fits of the data in Fig. 2 (see Table 1) plotted as a function of adaptational modification for Tar in the absence (−A/W, open circles) or presence (+A/W, solid circles) of signaling complexes. Lines are least square fits of the data. B. Ratios of vu in the presence (vu)+A/W versus the absence (vu)−A/W of the other components of signaling complexes. Error bars represent uncertainties estimated by error propagation. The line is presented to aid the eye. C. Means (circles) and standard deviations (error bars) for [Asp]½, derived from the fits of the data in Fig. 2 (see Table 1) plotted as a function of adaptational modification for Tar in the absence (−A/W, open circles) or presence (+A/W, solid circles) of signaling complexes. Lines are least square fits of the data. D. Ratios of [Asp]½ in the presence ([Asp]½ +A/W) versus the absence ([ASP]½−A/W) of the other components of signaling complexes. Error bars represent uncertainties estimated by error propagation. The line is a least square fit of the data.

