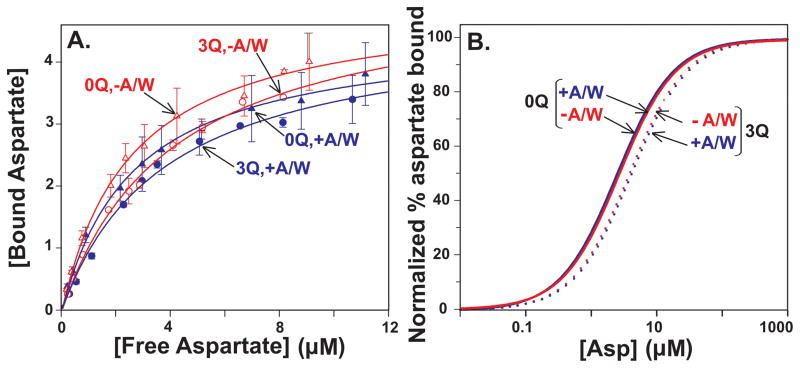
Fig. 5. Aspartate binding by Tar as a function of adaptational modification and ligand concentration.
A. Binding of radiolabeled aspartate to Tar embedded in native membrane vesicles and carrying 0 (EEEE, 0Q, triangles) or 3 (QEQQ, 3Q, circles) glutamines in the absence (−A/W, red, open symbols) or presence (+A/W, blue, solid symbols) of the other components of core signaling complexes plus CheY in conditions that produced maximum kinase activation and thus the highest level of functional signaling complexes. The plots show means (symbols) and standard deviations (error bars) for ≥3 independent experiments. The curves are fits of the data to a simple dose-response relationship (Experimental Procedures). Respective [Asp]½ values derived from these fits were −A/W: 0Q = 2.8 ± 0.1, 3 Q = 3.5 ± 0.9; +A/W: 0Q = 2.7 ± 0.5, 3 Q = 3.9 ± 0.3. B. Curves shown in Fig. 5A normalized to their respective maximal binding values.

