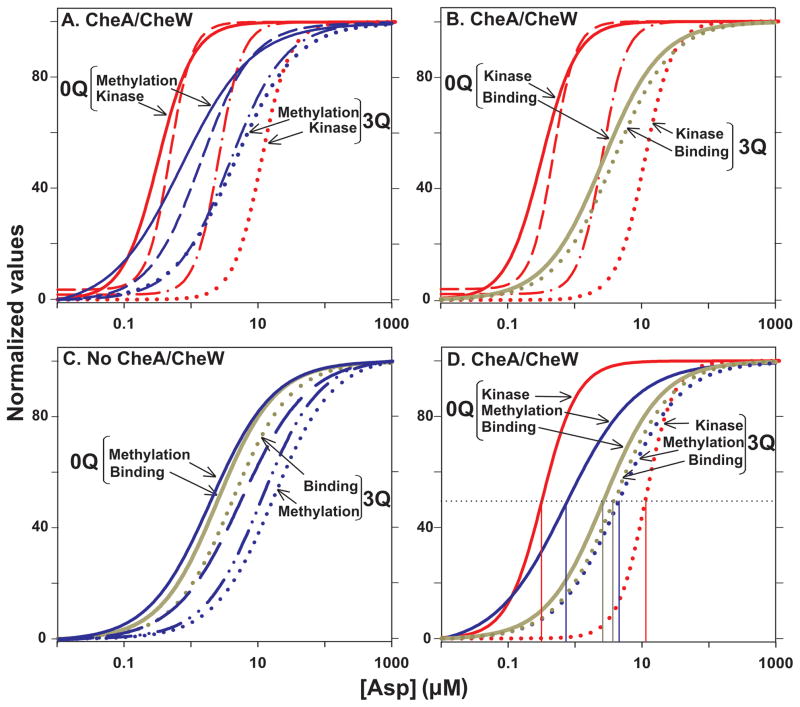
Fig. 7. Comparison of dose-response curves.
The normalized curves for initial rate of methylation from Fig 4A (Methylation), aspartate binding from Fig. 5B (Binding) and kinase activity from Fig. 6B (Kinase) as a function of aspartate concentration are compared in selected groupings. A. Comparison of initial rates of Tar methylation and kinase activity in conditions generating maximal formation of signaling complexes. Curves are shown for Tar with 0 to 3 modifications but only the extremes are labeled. B. Comparison of aspartate binding and kinase activity in conditions generating maximal formation of signaling complexes. Only the extremes of adaptational modification, no glutamines (0Q) and three glutamines (3Q) are labeled but curves are also shown for kinase activity with Tar carrying 1 and 2 modifications. C. Comparison of aspartate binding and initial rates of methylation for Tar in the absence of signaling complexes. As for Fig. 7A, only the extremes of adaptational modification, no glutamines (0Q) and three glutamines (3Q) are labeled but curves are also shown for initial rates of methylation activity with Tar carrying 1 and 2 modifications. D. Comparison of aspartate binding, initial rates of Tar methylation and kinase activity as a function of aspartate concentration in conditions generating maximal formation of signaling complexes. Curves are shown for Tar with 0 and 3 modifications, labeled as for the other panels. The thin vertical lines show the respective values for [Asp]½.

