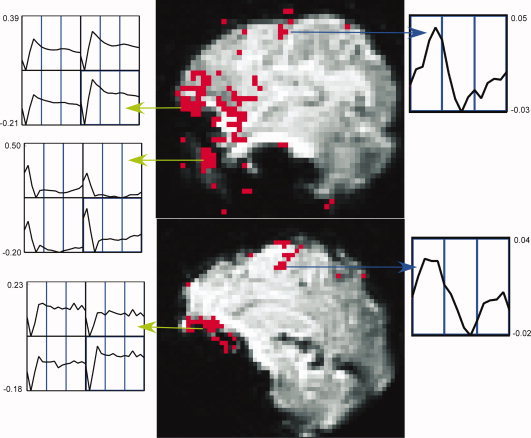
Figure 1.

Estimation of TCM IRFs from a lateral sagittal slice (top) and medial sagittal slice (bottom) for dataset P1. Activation map, thresholded at R 2 > 0.16, is overlaid on low‐resolution spiral FMR images. The green arrows point from clusters of voxels surmised to be TCM‐corrupted and screen‐grabs of the corresponding 2 × 2 voxel grid TCM IRF graphs generated by AFNI. The blue arrows are drawn between putative BOLD voxels and their corresponding BOLD IRFs. The horizontal axis for each of the individual voxel plots runs from 0 to 24.9 s. The vertical scales for all the individual plots are marked in units of fractional signal change.
