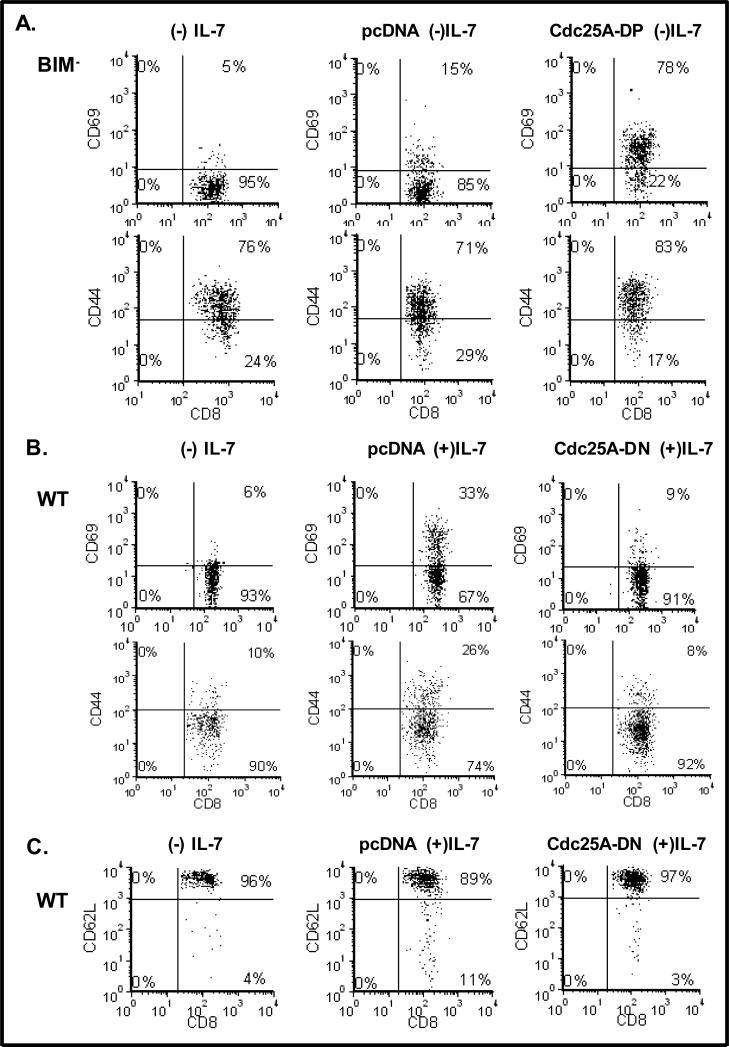
Figure 3. Expression of Cdc25A Mimics the Effect of High Dose IL-7, Promoting Activated T-cells that Down Regulate CD62L.
(A). Lymph node T-cells were isolated from Bim-/- mice that were expanded with IL-7 (150 ng/mL) for 48 hours. Nucleofection was used to transiently express the cDNA for Cdc25A-DP or vector only (pcDNA) and T-cells were cultured without (-) IL-7 for 24 hours. Untransfected cells are also shown for comparison. Dot plots display CD69 or CD44 surface expression on CD8 T-cells as determined by staining with a FITC-conjugated CD69 antibody and a PerCP-conjugated anti-CD8 antibody and analyzed by flow cytometry as described in Materials and Methods. (B-C). Lymph node T-cells were isolated from WT C57BL/6 mice, and nucleofection was used to transiently express the cDNA for Cdc25A-DN or vector only (pcDNA). WT T-cells were cultured with (+) IL-7 for 24 hours. Untransfected cells cultured without (-) IL-7 are also shown for comparison. Dot plots display CD69 or CD44 surface expression on CD8 T-cells as determined by staining with FITC-conjugated CD69 and CD44 antibodies (B) or PE-conjugated CD62L antibody (C) and a PerCP-conjugated anti-CD8 antibody and analyzed by flow cytometry as described in Materials and Methods. A representative experiment of three performed is shown.

