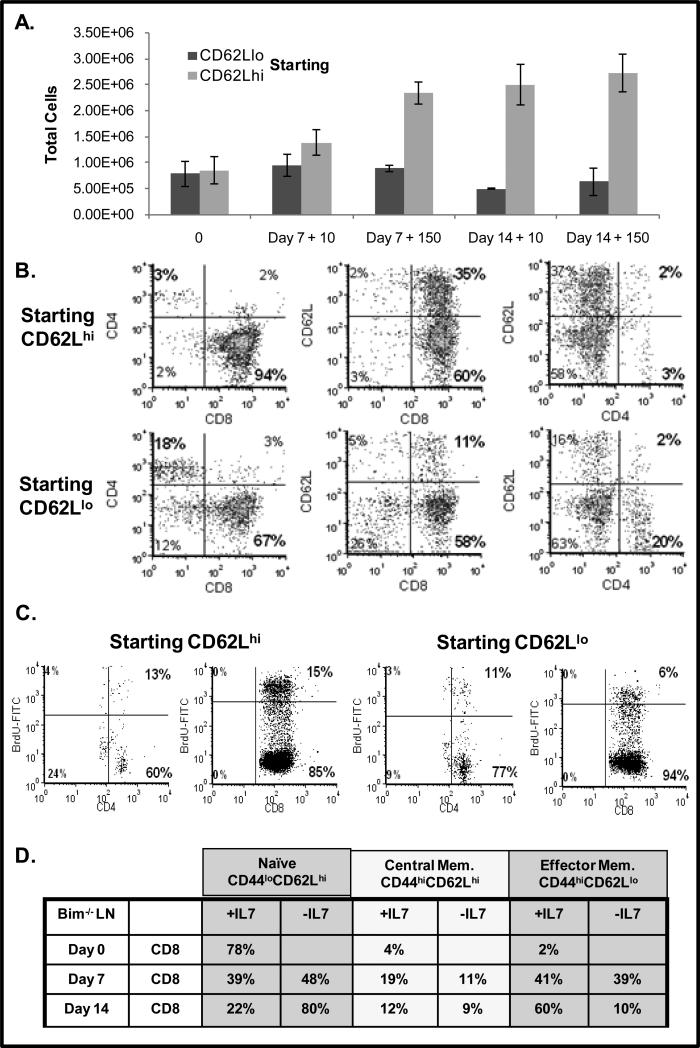
Figure 6. In Vitro Culture with High Dose IL-7 Promotes Proliferation and Down regulation of CD62L on CD8 T-cells.
(A-C). Splenic CD62Llo or CD62Lhi T-cells were isolated from Bim-/- mice and sorted using anti-CD62L antibody and magnetic beads as described in Materials and Methods. Cells were placed in culture without IL-7 or with 10 or 150 ng/mL of IL-7 and assayed after 7 or 14 days. (A). T-cell numbers from populations of cells that were initially sorted for CD62Llo or CD62Lhi expression was determined using the Accuri flow cytometer and confirmed by microscopic evaluation as described in Materials and Methods. (B). Dot plots display ratio of CD8 and CD4 T-cells and surface levels of CD62L on CD62Llo or CD62Lhi T-cells after 14 days of culture in 150 ng/mL IL-7. Phenotype was determined by staining with a FITC-conjugated anti-CD4 antibody or a PerCP-conjugated anti-CD8 antibody and a PE-conjugated CD62L antibody and analyzed by flow cytometry as described in Materials and Methods. Results shown were acquired from the viable cell gate. (C). Cell cycling of CD62Llo or CD62Lhi T-cells was assessed after 7 days of culture in 150 ng/mL IL-7 by measuring the incorporation of BrdU into replicating DNA with a FITC-conjugated BrdU antibody and CD4 or CD8 expression determined as described using flow cytometry (A). Quadrants were established using control antibodies. Percentages in bold indicate CD4 or CD8 T-cells that had incorporated BrdU. (D). Unsorted lymph node T-cells were isolated from Bim-/- mice and placed in culture without IL-7 or with high dose IL-7 (150 ng/mL) for 7 or 14 days. At the indicated time points, cells were stained with antibodies for CD4, CD8, CD44 and CD62L as described in Materials and Methods. Surface expression was analyzed by flow cytometry. Table 2 data is gated on CD8 T-cells and is presented as a percentage of total viable cells expressing the indicated phenotype. Results from a representative experiment of two experiments performed are shown.

