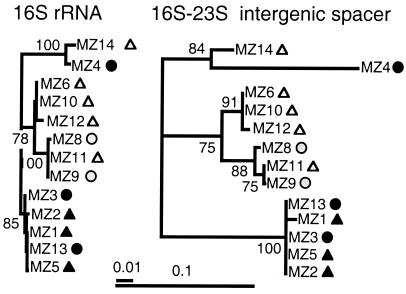
Figure 2.
Phylogenetic trees constructed from the 16S rRNA gene and the IGS region of the 13 Endeavour isolates. Percent of 1,000 bootstrap replicates supporting clusters is shown. Organisms represent samples from two vent fields, High Rise (triangles) and the Main Endeavour Field (circles) (Fig. 1) and two biotopes, sulfides (dark) and the subseafloor (light). Organisms clustered with respect to biotopes but not with respect to geographic separation. Scale for the two trees is identical; small bar represents one change per hundred nucleotides.

