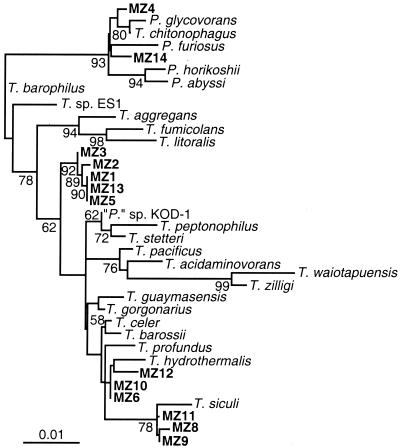
Figure 3.
Minimum-evolution distance tree made with the full length of the 16S rRNA gene showing position of Endeavour isolates relative to characterized species in the genera Thermococcus and Pyrococcus. Bootstrap values are shown for all groups with over 50% bootstrap support (162 replicates). Scale is one change per hundred nucleotides.

