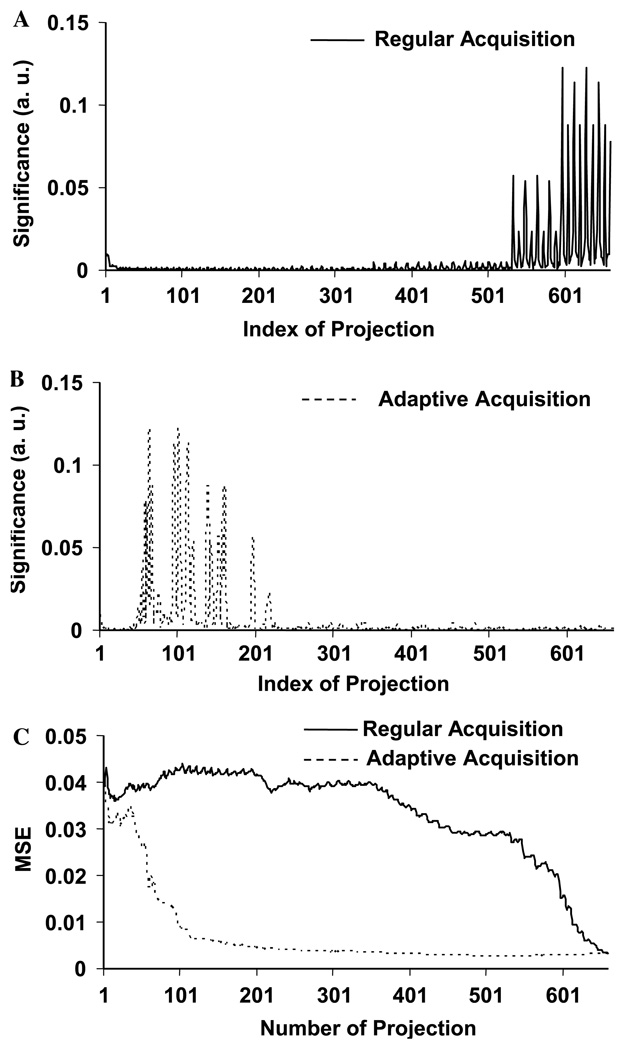
Fig. 4.
Significance distribution of projections and reconstruction error. (A) and (B) Significance distribution of projections. The significance of a projection (also in Figs. 6 and 8) is defined in Eq. (9) as the mean-square amplitude of the projection after filtering. In the regular data acquisition, all the projections were acquired in a nested-loop order. With this phantom, all the important projections were actually located at the end. In the adaptive acquisition, all the projections (except the first 10%) were acquired according to their significance values, from the most important to the least important. The adaptive algorithm was able to determine all the most important projections and acquire them within the first 250 projections. (C) Reconstruction error. In the regular data acquisition, since the important projections were located at the end, the reconstruction error converges very slowly. With the adaptive algorithm, all the important projections were identified and acquired prior to the less important projections. The construction error converges roughly at the number of 300. The improvement of the data acquisition efficiency is clearly seen.

