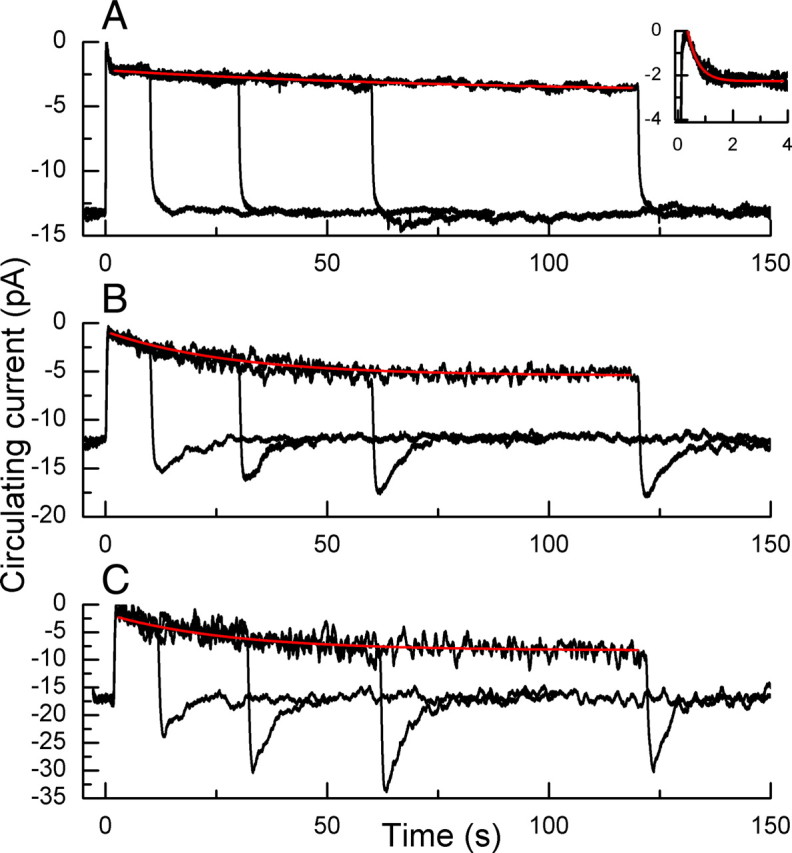
Figure 5.

Change in circulating current to steps of light of varying duration. A, WT rods. Data traces are superimposed means of currents of seven rods each exposed three times to steps 10, 30, 60, and 120 s in duration of intensity of 440 photons μm−2 s−1. Red trace is best-fitting single-exponential decay function with a time constant of 84 s. Insert shows first 4 s at higher time resolution; red trace is best-fitting single-exponential decay function with time constant of 380 ms. B, GCAPs−/− rods. Superimposed mean responses of three presentations each from five rods to a step of light of intensity 38 photons μm−2 s−1 for the following durations: 10, 30, 60, and 120 s. Red trace is best-fitting single-exponential decay function with time constant of 28 s. C, CNGB1ΔCaM/GCAPs−/− rods. Superimposed mean responses of three presentations of 2 rods to a step of light of intensity 38 photons μm−2 s−1 for the following durations: 10, 30, 60, and 120 s. Red trace is best-fitting single-exponential decay function with time constant of 28 s.
