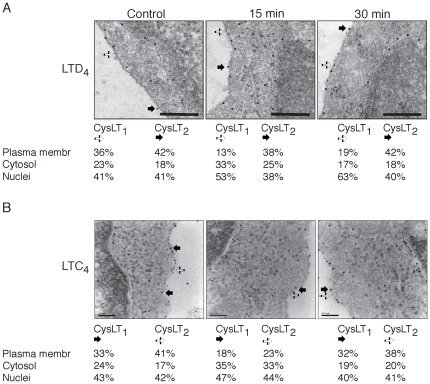
Figure 3. Electron microscopy images of CysLT1R and CysLT2R.
Electron microscopy of Int 407 cells treated without or with (A) LTD4 (40 nM, 15 or 30 minutes) or (B) LTC4 (40 nM, 15 or 30 minutes). Samples of intact cells used for electron microscopy were prepared by pelleting 5×10⁶ cells immediately after adding a fixative (4% paraformaldehyde and 0.1% glutaraldehyde). Ultra thin sections were cut on a microtome and mounted on nickel grids, followed by overnight incubation with the primary antibody against CysLT1R and CysLT2R. (A) The antibody directed against the CysLT1R was labeled with 10-nm colloidal thiocyanate gold (black arrow) and CysLT2R with 5-nm colloidal thiocyanate gold (white arrow). The scale bar represents 0.2 µm. (B) The antibody directed against the CysLT1R was labeled with 5-nm colloidal thiocyanate gold (white arrow) and CysLT2R with 10-nm colloidal thiocyanate gold (black arrow). The scale bar represents 0.1 µm. The specimens were examined using a Jeol JEM 1230 electron microscope operated at 60 kV accelerating voltage, and images were recorded with a Gatan Multiscan 791 CCD camera.

