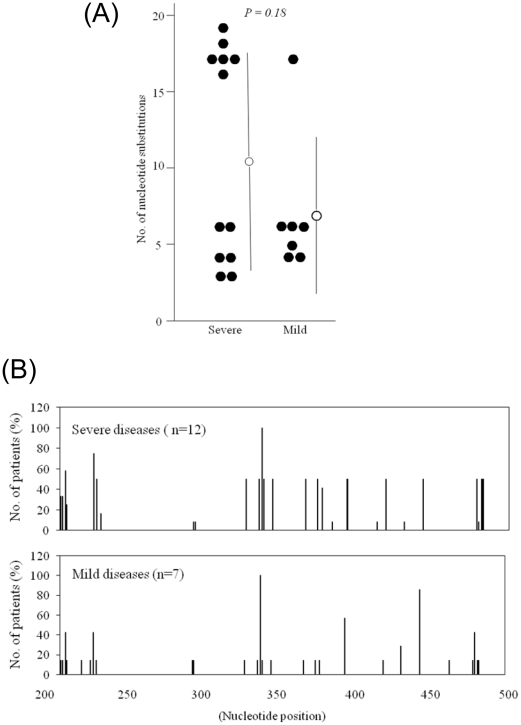
Figure 1. Disease severity and nucleotide substitutions in HAV IRES when compared with HAV GBM.
(A) Number of nucleotide substitutions between nucleotides 200 and 500. Nucleotide sequences were compared with HAV GBM/WT RNA (X75215) [15]. Bars represent mean (SD). Severe, severe disease; Mild, mild disease. (B) Distribution of nucleotide substitutions between nucleotides 200 and 500 of the 5′ non-translated region. Bars indicate the percentage of cases with substitutions at each nucleotide position.

