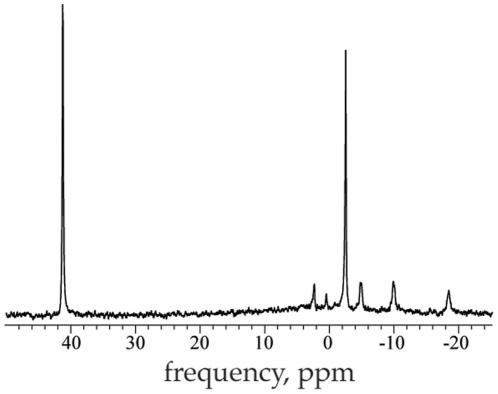
Figure 2. A sample in vivo spectrum with real peaks and the artificially injected pseudo-peak.
The Pi, PCr and the γ, α, and β moieties of ATP appear at about 2.5, 0.5, −2.5, −5.0, −10, and −18.5 ppm, respectively. The pseudo-peak appears at 41 ppm. The amplitude, frequency, phase, and line-width of the pseudo-peak are determined by the digitized waveform transmitted by the RF synthesizer and are easily adjusted.

