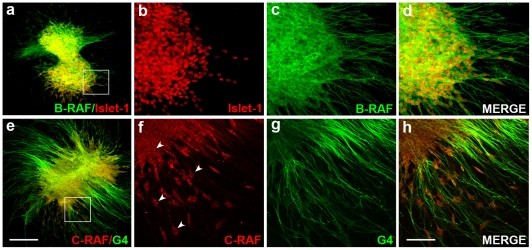
Figure 6. RAF proteins show different subcellular distribution in the acoustic- vestibular ganglion.
AVG explants were obtained from stage HH19 chicken embryos and cultured in serum-free medium for 20 h with no additives (0S). (a–d) Whole AVG explants were immunostained for B-RAF (green) and Islet-1 (red) or (e–h) for C-RAF (red) and G4 (green), The cytoplasmatic distribution of C-RAF is shown (arrowheads). Fluorescence images were obtained from compiled projections of confocal images of AVG. Scale bar, 350 µm (a, e); 75 µm (b–d, f–h).

