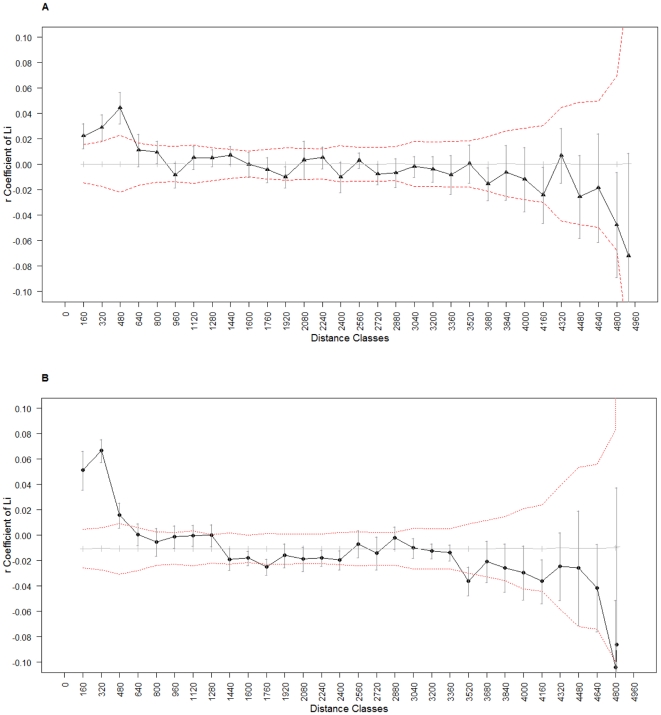
Figure 1. Spatial auto-correlograms of the coefficient r in relation to distance for pairs of individuals.
We represented the estimated genetic correlation coefficient r of Li et al. (1993) (black line) in relation to inter-individual distance for pairs of females (A) and males (B), respectively. Error bars represent the standard error around r. The permuted 95% confidence intervals (dashed red lines) around the null hypothesis of a random distribution of individuals (average coefficients after random permutations; gray line) are also shown.

