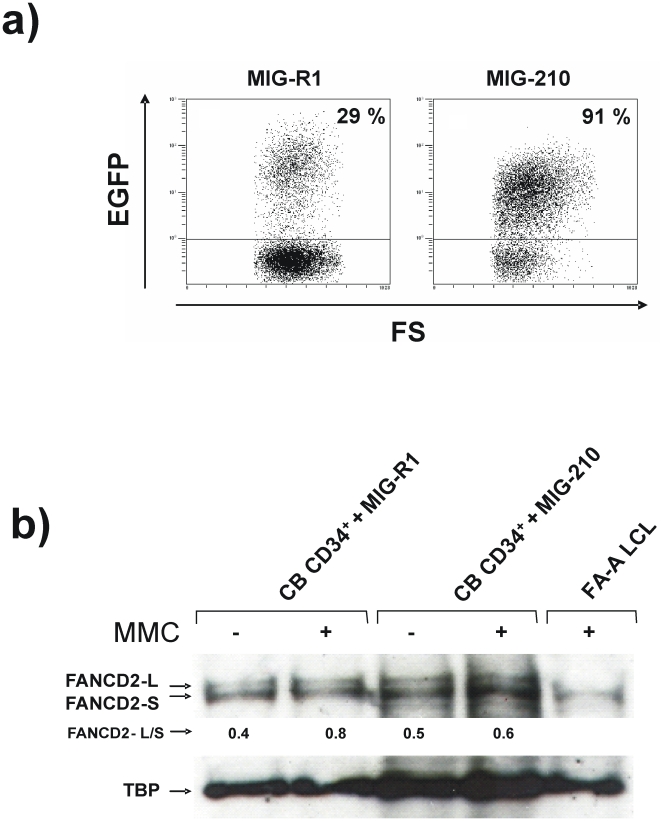
Figure 3. Efficient monoubiquitination of FANCD2 in BCR/ABL- transduced cord blood CD34+ cells.
a) Flow cytometry analysis showing the proportion of cord blood CD34+ cells expressing the retroviral marker EGFP, 7 days after transduction with MIG-R1 or MIG-210 vectors. b) Western blot analysis of monoubiquitinated (FANCD2-L) and non ubiquitinated FANCD2 (FANCD2-S) in samples shown in panel a. As a negative control of FANCD2 ubiquitination, LCLs from a FA-A patient was also included. Ratios between FANCD2-L/FANCD2-S are shown.

