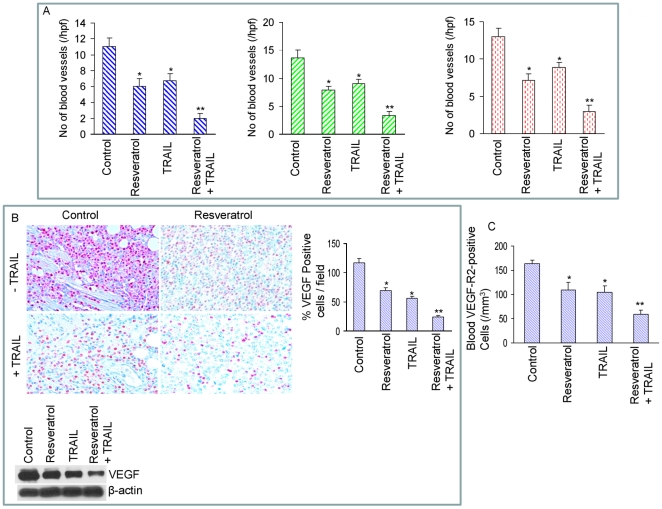
Figure 6. Effects of resveratrol and/or TRAIL on markers of angiogenesis.
(A), Left panel, tumor tissue sections derived from control, resveratrol and/or TRAIL treated mice on week 6 were stained with H & E and the numbers of blood vessels were counted at 400 X magnification. Each column represents the mean ± SD. * or ** = significantly different from control, P<0.05. Middle panel, blood vessel quantification in tumors derived on week 6. Tumor sections from control and drug treated mice were stained with anti-CD31 antibody, and the numbers of CD31-positive blood vessels were counted. The results are shown as the mean ± SD. * or ** = significantly different from control, P<0.05. Right panel, tumor sections from control and drug treated mice obtained on week 6 were stained with anti-von Willebrand Factor (vWF) antibody to evaluate blood vessels. The results are shown as the mean ± SD. * or ** = significantly different from control, P<0.05. (B), Left panel, immunohistochemistry was performed to measure the expression of VEGF in tumor tissues derived from control and drug treated mice on week 6. Right panel, quantification of VEGF positive cells in tumor tissues. Right panel, quantification of VEGF positive cells. The results are shown as the mean ± SD. * or ** = significantly different from control, P<0.05. Bottom panel, expressions of VEGF and β-actin in tumor tissues derived on week 6 were measured by the Western blot analysis. (C), VEGF receptor 2 (VEGF-R2)-positive circulating endothelial cells in mice on week 6. The blood cells from peripheral blood attached to the slide were stained with anti-VEGF-R2 antibody, and the number of VEGF-R2 positive cells was counted under a microscope. The results are shown as the mean ± SD. * or ** = significantly different from control, P<0.05.

