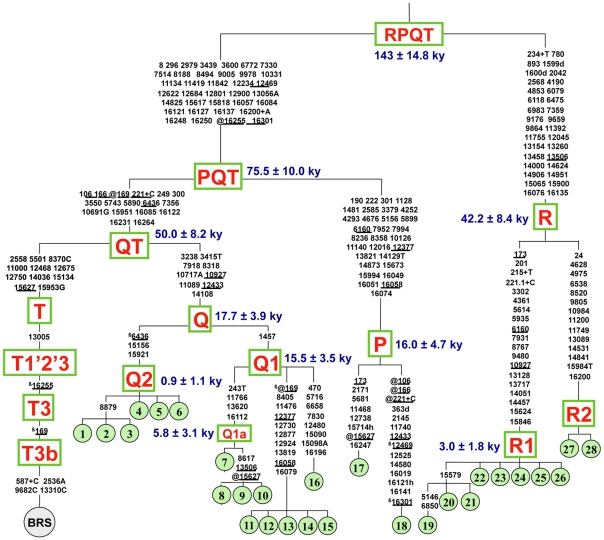
Figure 2. Tree of complete bovine mtDNA sequences.
This tree, built and rooted as previously described by Achilli et al. 2008 [9] illustrates the relationships between the common haplogroup T represented by BRS and the rare mtDNAs belonging to haplogroups P, Q and R. Shown divergence times are those obtained using ML as reported in Table 3. Mutations are shown on the branches and are numbered according to the BRS; they are transitions unless a base is explicitly indicated; suffixes indicate transversions (to A, G, C, or T) or indels (+, d) and should be read as if the BRS was an artificial root. Recurrent mutations are underlined, and true back mutations with respect to evolutionary direction are prefixed with the superscript β (beta) in addition (which is thus in alternation with prefix @ on the path between the overall root and BRS). Note that the reconstruction of recurrent mutations in the control region is ambiguous in a number of cases. Heteroplasmy is marked with a suffix (h). The numbering of sequences is the same as in Figure 1.

