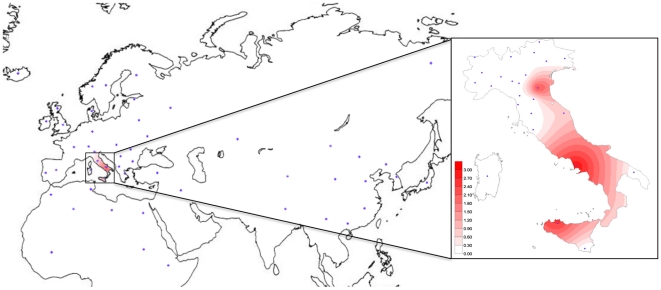
Figure 3. Spatial frequency distribution (%) of haplogroup R.
The dots indicate the geographical location of the populations included in the survey. Population samples and corresponding frequency values are listed in Table S2. This frequency map was obtained using Surfer version 6.04 (Golden Software, Inc.), with the Kriging procedure, and estimates at each grid node were inferred by considering the entire data set.

