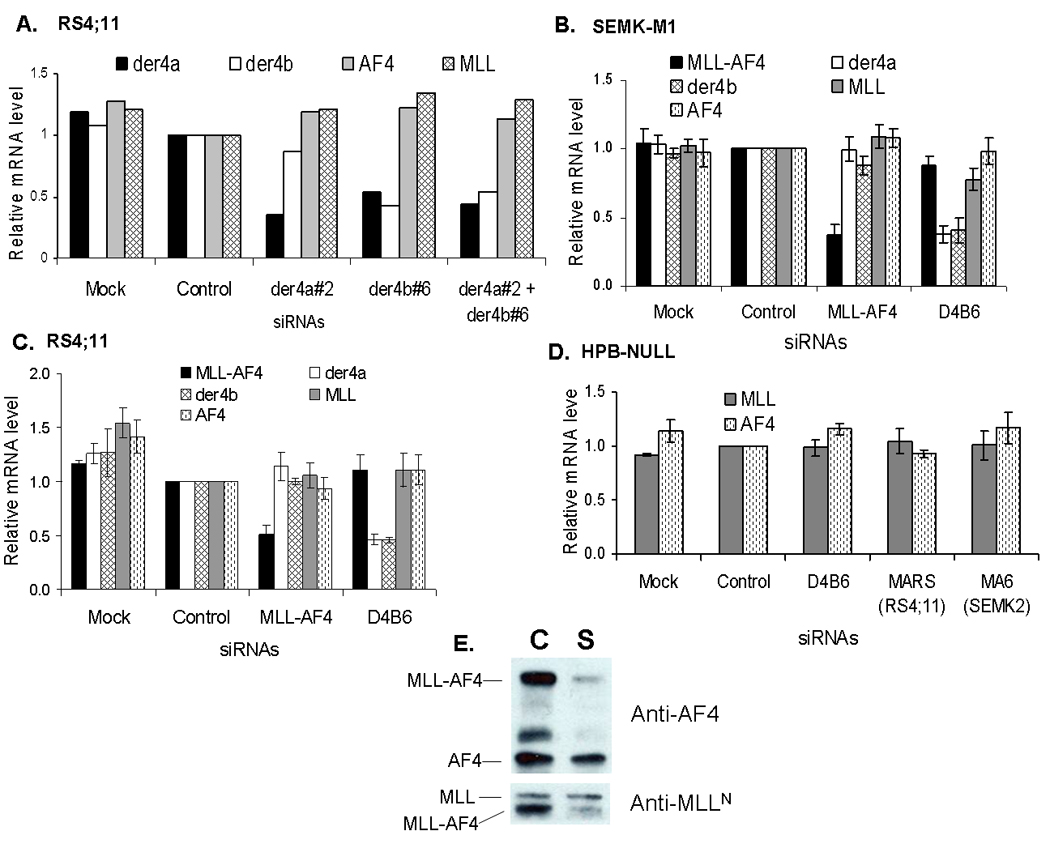
Figure 1. siRNAs againt MLL-AF4 and AF4-MLL specifically knockdown their respective targets.

Human leukemia cell lines were electroporated with various siRNA duplexes as described and gene expression measured by real time quantitative RT-PCR at 24 hours. Bar graphs show relative expression of AF4-MLL (der4a and der4b), MLL-AF4, AF4 and MLL in RS4;11 (A, C) and SEMK2-M1 (B) cells while HPB-NULL (D) served as a control cell line since it lacks the MLL-translocation. Relative expression levels were derived using beta-actin as internal control and normalized to levels in the scrambled control condition. Panel A shows data from one representative experiment in RS4;11 while for the remaining graphs data represent mean ± std. err of 3 separate experiments. Panel E shows Western blot results for MLL-AF4 knockdown in SEMK2-M1 probed with anti-AF4 (upper panel) or anti-MLLN (lower panel) antibodies. Lane labels on top represent the siRNA treatments – control (C) or MA6 (S) - the SEMK2-specific MLL-AF4 siRNA. Protein bands are labeled on the left and the antibodies used in each blot are on the right.
