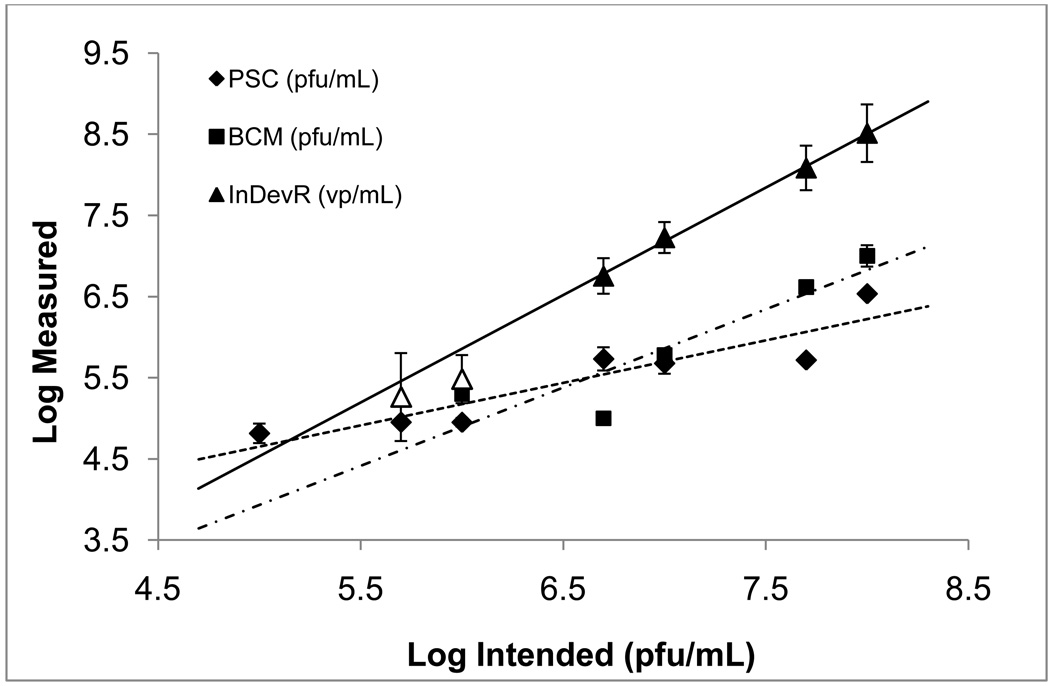
Figure 2. Comparison of log-scale assay results for samples diluted in SDB.
Data points represent the mean measured result of samples 1b–7b with error bars representing ±1σ from the mean. Within the Virus Counter data set (triangles), results for samples 5b and 6b are shown as unfilled triangles to indicate that these values were below the SQL determined for SDB and were not included in the linear regression fit to the data. Sample 7b returned a zero count and is not included in the figure or the regression fit to the data. Coefficients of determination (R2) for the linear regressions fits to the data were 0.85 for Protein Sciences Corporation (diamonds with a dashed line), 0.82 for Baylor College of Medicine (squares with a dot-dash line) and 1.0 for InDevR (triangles with a solid line). Slopes of the regression fits were 0.5 ± 0.1 for Protein Sciences Corporation, 1.0 ± 0.3 for Baylor College of Medicine and 1.32 ± 0.04 for InDevR. Pearson correlation coefficients for the Virus Counter, Protein Sciences Corporation and Baylor College of Medicine were r = 1 (p < 0.001), r = 0.92 (p < 0.01) and r = 0.90 (p < 0.05), respectively.

