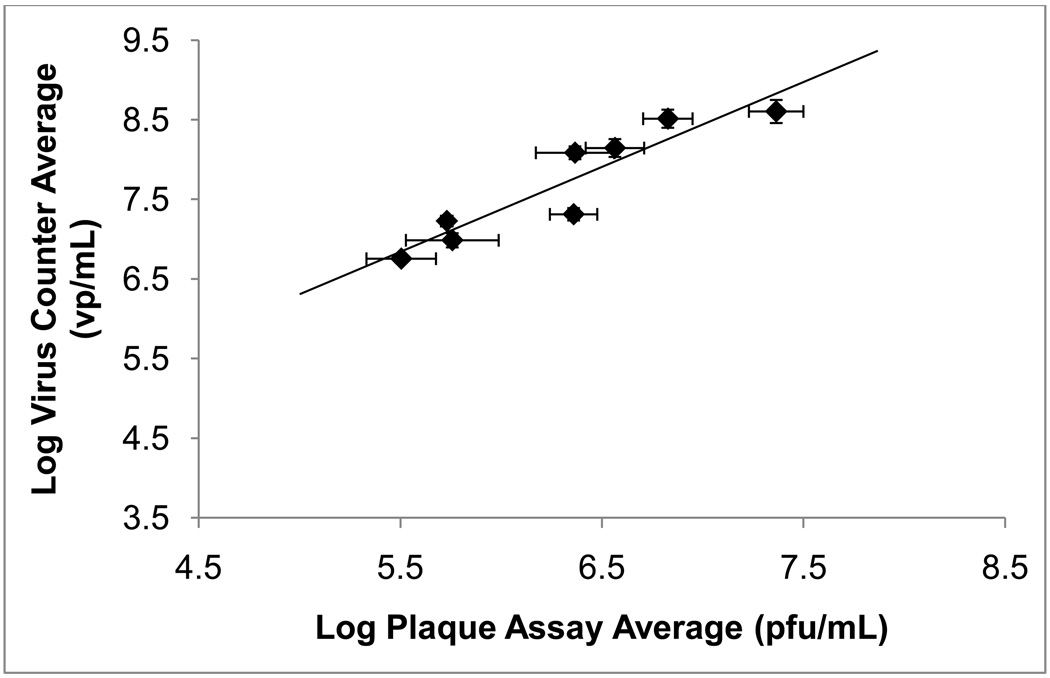
Figure 3. A log-scale correlation of Virus Counter and plaque assay results.
Mean results for all samples above SQL (i.e. both PSFM and SDB) are shown. Mean plaque assay results are the combined results from Baylor College of Medicine and Protein Sciences Corporation. Error bars represent the standard error of the mean. The solid line represents a linear regression fit to the data and was obtained with a coefficient of dertermination (R2) of 0.86 and a slope of 1.1 ± 0.2. The Pearson correlation coefficient was determined to be 0.93 (p < 0.001).

