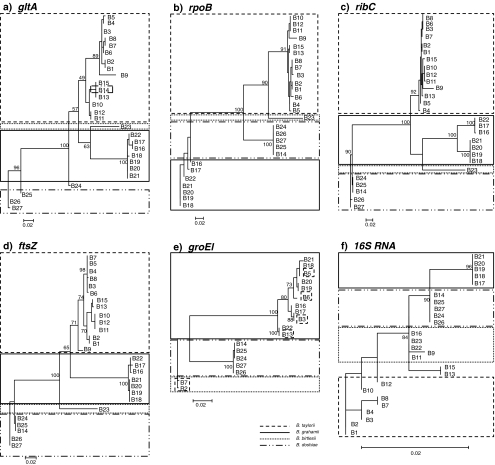
Figure 4.
Comparison of phylogenies obtained with the metabolic genes analysed in this work: gltA, ftsZ, ribC, rpoB, groEl and gene coding 16S RNA. Phylogenies generated using maximum likelihood (PhyML) with 100 bootstrap replicates. Species identities boxed, based on nearest match to type sequences from GenBank. Note the lack of support for B. taylorii with groEl

