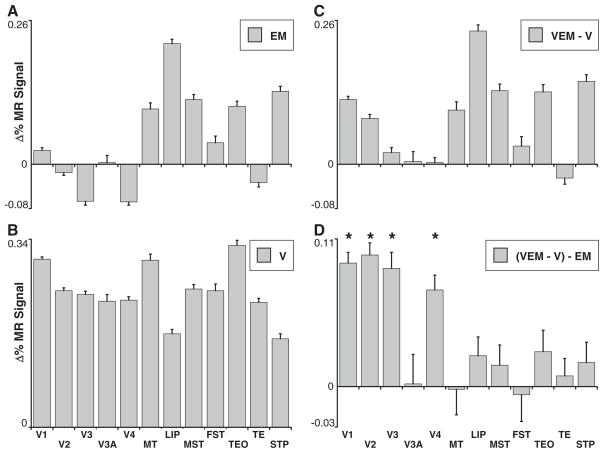
Fig. 2.
Gating of FEF-EM effects by a visual stimulus. Mean percentage change in MR signal relative to fixation-only (MM1 and MM2) for all visually driven voxels (P < 0.05, uncorrected) in 12 visual areas for (A) EM and (B) V epochs, (C) the difference between VEM and V epochs, and (D) the interaction (VEM-V-EM). Error bars denote SEM; * indicates a significant difference between the VEM-V and EM distributions (P < 10−17, two-sample, two-tailed t test), revealing that on average voxels in early visual areas show a larger EM response in the presence of visual stimuli than in the absence. Higher-order visual areas show an EM response both with and without visual stimulation.

