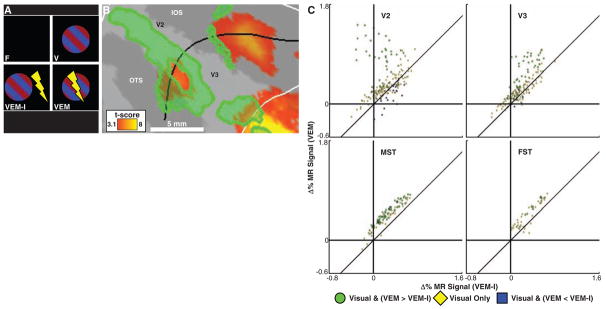
Fig. 4.
Retinotopic specificity of FEF-EM induced modulations. (A) The design used to test for retinotopic specificity of the interaction between EM and visual stimulation (VEM-I, incongruent visual stimulation and FEF-EM). (B) Flattened, right occipital cortex (MM1). Yellow-orange voxels show a visual-only response (P < 0.001, uncorrected); green voxels are visually driven and exhibit more activity during congruent than during incongruent visual stimulation (P < 0.05, conjunction). Sulci and white and black lines are as in Fig. 3C. (C) Responses of voxels (percentage change in MR signal, MM1) in areas V2, V3, MST, and FST (see also fig. S11) during the VEM-I (x axis) and VEM (y axis) epochs relative to the fixation epoch. Color code matches (A) (yellow now at P < 0.05, uncorrected; blue at P < 0.05, conjunction).

