
Figure 4. Example of SAXS Analysis.
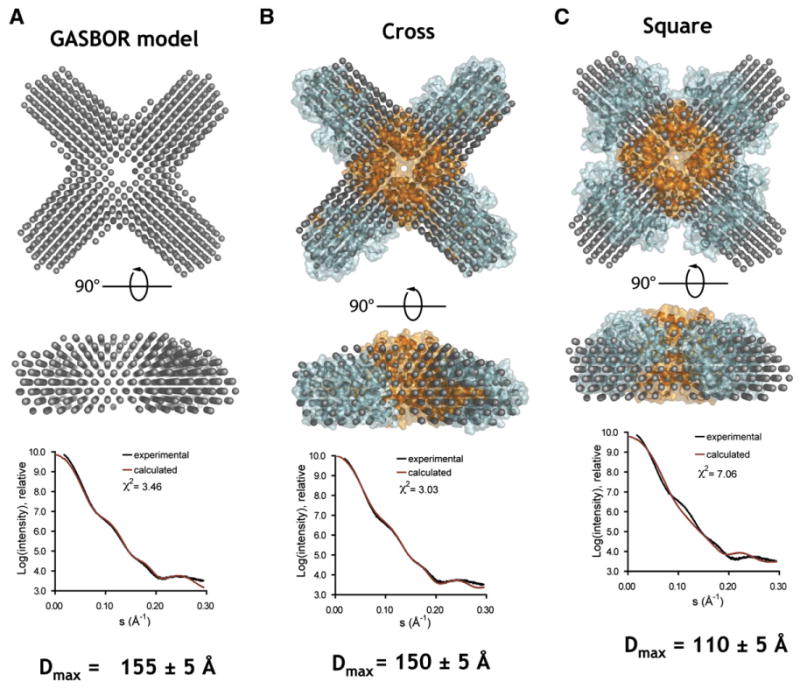
(A) Top shows the ab initio model for SAXS data from the Kv4.3 T1 domain/KChIP1 complex calculated from the scattering data. The bottom panel shows the scattering intensity profile for the data (black) and the model (red). (B) Comparison of the crystal structure of the Kv4.3 T1 domain/KChIP1 complex with the ab initio model shows excellent correlation with the data in contrast to an alternative square-shaped arrangement shown in (C). The Dmax values show the maximal dimension of the particles calculated from the data (A) and from the models (B and C). Data are from Pioletti et al. (2006).