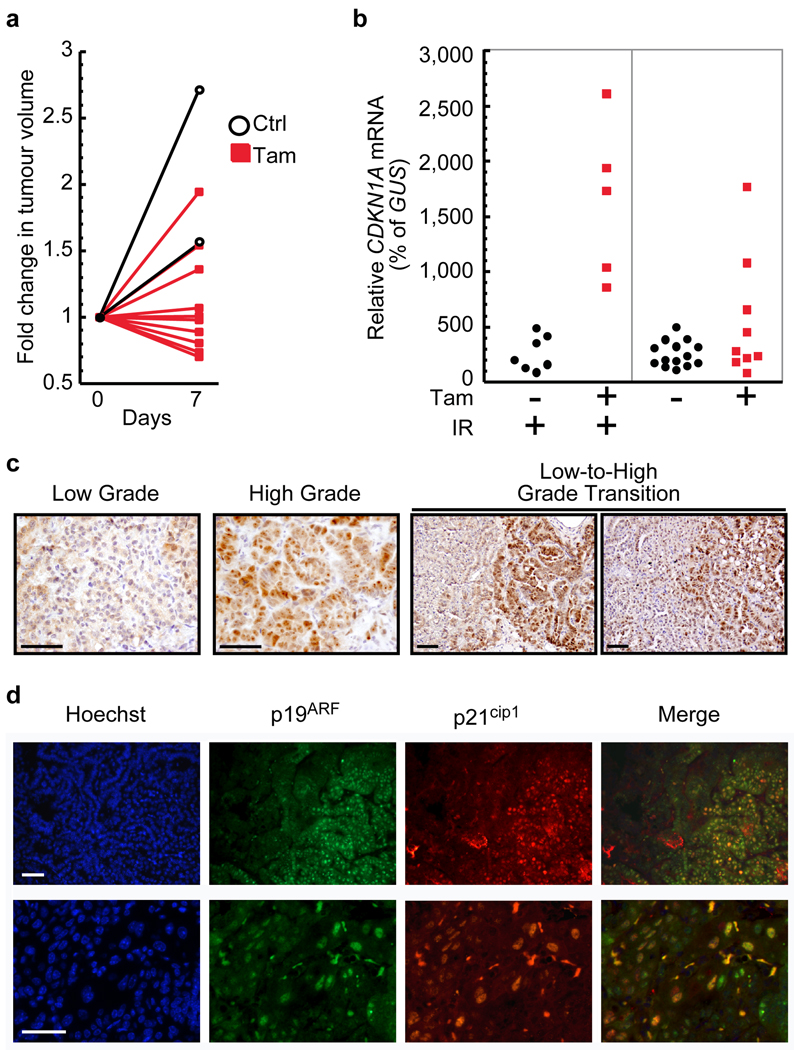
Figure 2. Heterogeneous p53 activation and p19ARF up-regulation in KR;p53KI/KI tumours.
a. MicroCT-derived plots depicting changes in tumour volume during a 7-day treatment. 10 independent tumours are shown before (day 0) and after (day 7) daily Tam (red lines, filled symbols) or sham (black lines, open symbols) treatments.
b. Taqman analysis of CDKN1A expression in individual laser-captured lung tumours from KR;p53KI/KI mice treated for 7 days with vehicle (black circles) or Tam (red squares). Tumours were harvested 24 hrs after the final Ctrl/Tam treatment. Where indicated (IR +, left panel) mice were exposed to a single dose of γ-radiation 2 hrs after the last Tam/Ctrl treatment. Each circle/square represents a single tumour.
c. IHC data comparing levels of p19ARF expression in low and high-grade tumours as well as in transitional lesions exhibiting both low and high-grade features. Scale bars=50 µm.
d. Co-immunostaining for p19ARF and p21cip1 in KR;p53KI/KI lung tumours from mice treated for 6 hrs with Tam. Representative fields shown, one at low (upper panel) and one at high magnification (lower panel). Scale bar=50 µm.

