Figure 5.
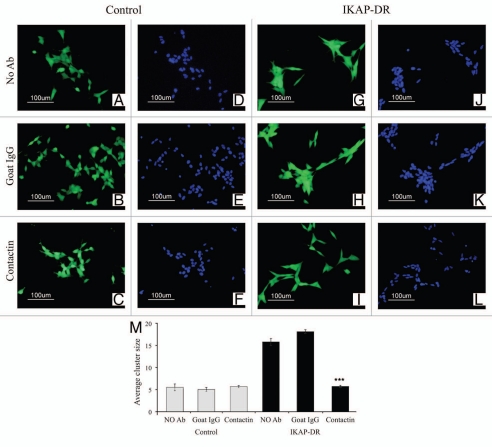
Control cells stained with calcein or Hoechst stain and grown on laminin with no added antibody (A and D), with goat IgG (B and E) or with anti-Contactin1 antibody (C and F), compared to IKAP-DR cells grown with no added antibody (G and J), with goat IgG (H and K) or with anti-Contactin1 antibody (I and L). In (M), a graphic summary of the average number of cells in a cluster for each of the cell lines and growth conditions is shown. ***p value < 0.001.

