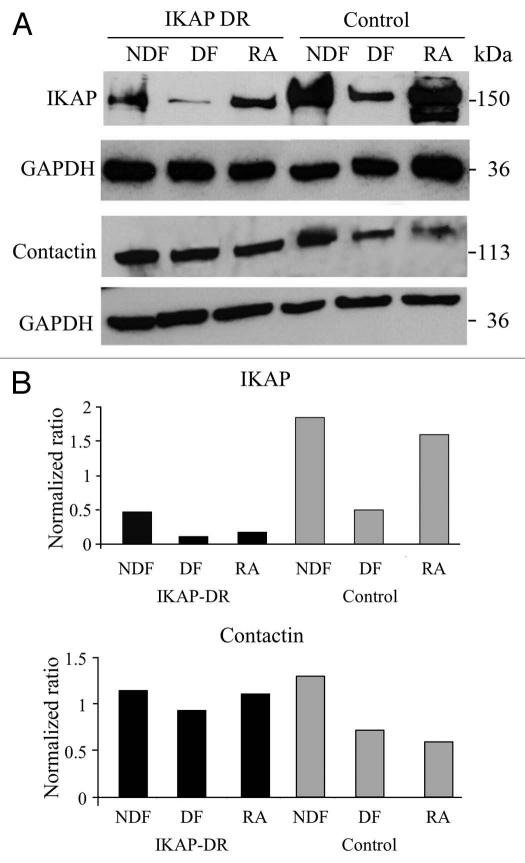
Figure 6.
(A) Western blot analyses showing the expression of IKAP and of Contactin1 proteins in IKAP-DR or control cells grown in non-differentiation (NDF), in differentiation (DF) or with retinoic acid only (RA) conditions. For both analyses, GAPDH expression was used for normalization. In (B) the ratio between the expression levels of IKAP and GAPDH (upper graph) or Contactin1 (lower graph) and GAPDH is shown.

