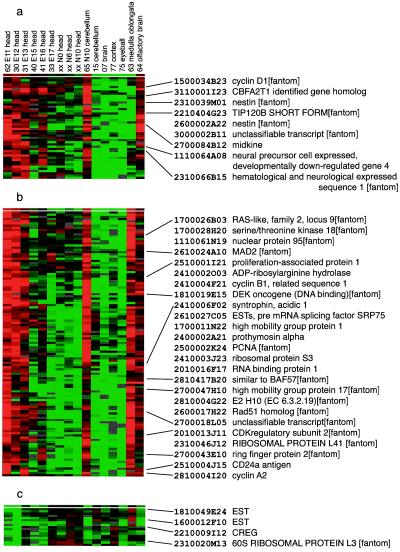
Figure 2.
Hierarchical clustering of tissue expression profile of developmental stage of CNS. (a, b, and c) Expanded views of biologically distinct gene expression signatures in the CNS set. Genes inversely correlated with cyclin D1 were extracted and shown in c. All of the gene names included in these clusters are provided in Fig. 8 a, b, and c, respectively, which is published as supplemental data on the PNAS web site, www.pnas.org.

