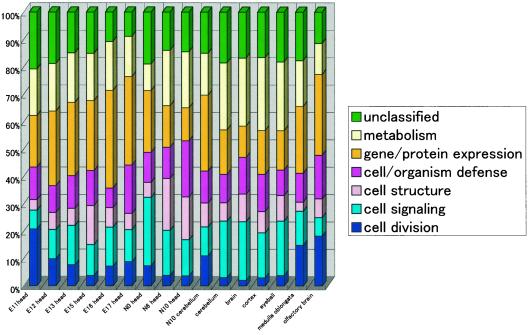
Figure 3.
Ratios of cellular roles for each CNS tissue. Cellular roles were assigned to the 2,206 genes in light of results from searching the TIGR EGAD database (http://www.tigr.org/tdb/egad/egad.shtml). Ratios of cellular roles for all of the 49 tissues are also available in supplementary data at (http://genome.gsc.riken.go.jp/READ/supplementary/).

